Power Apps - Creating Reports of SharePoint list data with Power BI
 Once Your Power Apps application has been running you will most likely want to create reports on the data collected
As Southwest Airlines moves forms over to PowerApps the data will all reside in SharePoint. SharePoint lists become a data repository containing much valuable business information. So, with all this information residing inside of SharePoint, what can end-users utilize to create reports to help them make better business decision from the data collected? The answer is Power BI.
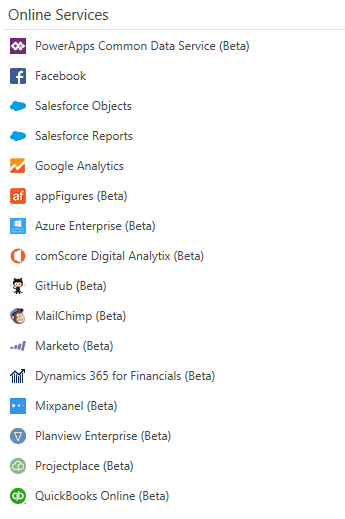
What is Power BI online service?Power BI is an online reporting service provided by Microsoft that gives the subscriber the ability to create reports and dashboards for a single or multiple data sources. Examples of data sources that Power BI can connect to are listed below:
What is the Power BI desktop application?
Power BI Desktop is a report authoring tool that lets you create reports from multiple data sources or online services that can be published to the Power BI service.
Create a report from a SharePoint Online list using the Power BI desktop application
Launch the Power BI desktop application. If you do not have it you can download it here: Microsoft Power BI Desktop Application.
Click on Get Data in the ribbon and select More from the drop down menu.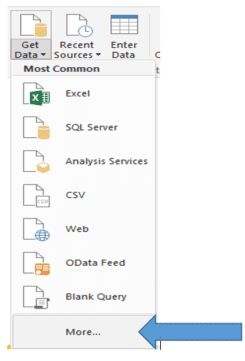
In the left-hand navigation of the pop-up window, select Online Services, select SharePoint Online List, and then Connect.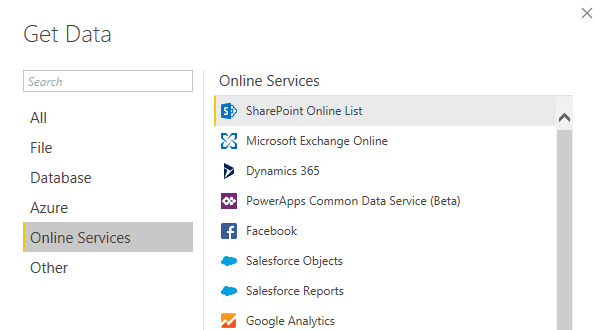
In the URL field enter the SharePoint site URL where the list is located, and then select Ok. Enter your credentials if prompted. Once connected, in the Navigator window select the list or lists you would like to connect to.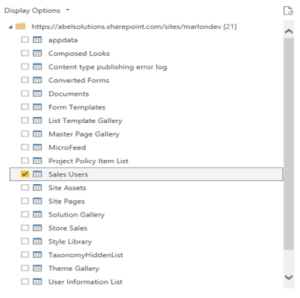
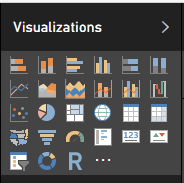 Select the Edit button to customize the imported data or Load to import the selected data. Once the data is imported we can start creating a report. There are several pre-built visualization templates for use or you can import your own visualization template.
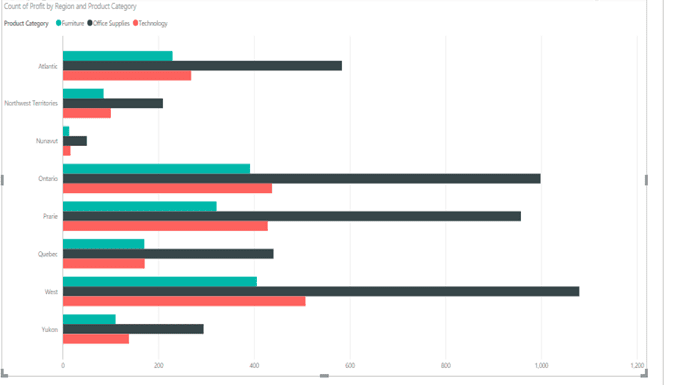
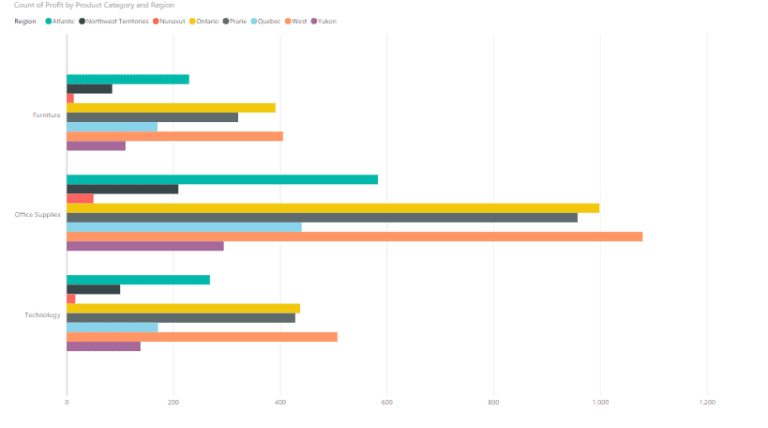
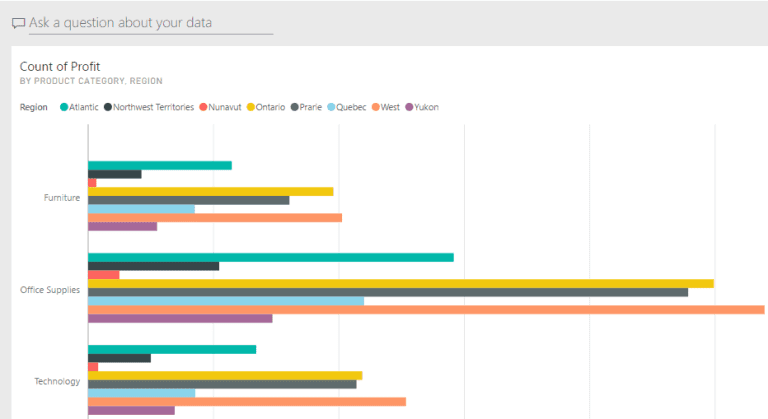
To illustrate, I will create two visualization reports. The first report will be a bar chart and the second will be a pie chart. I will start by creating a bar chart report that will show the profit of the product category by region. This report has the ability to drill-down to the product name to show the profit of that product.
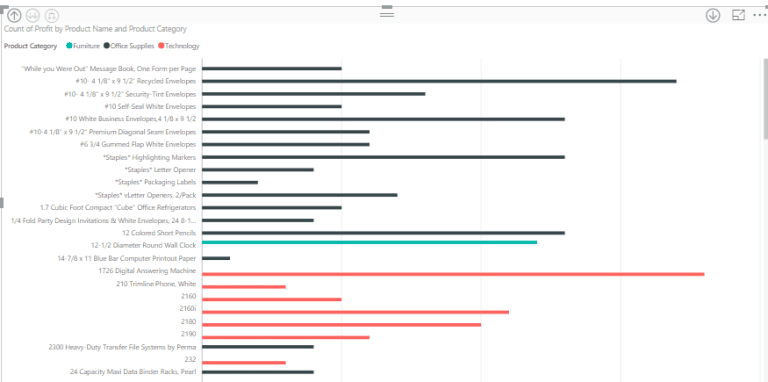
Drill down to Product Name and Product Category report:
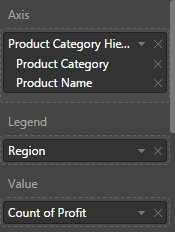
Bar Chat visualization configuration:
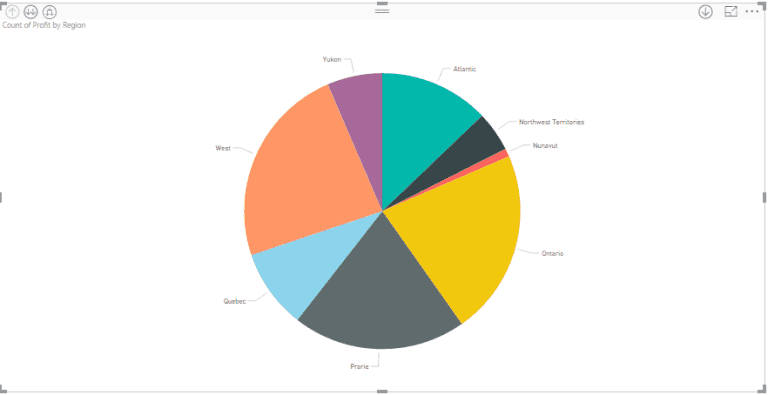
The second report will display the same information but will display in a pie chart with the ability to drill-down one level in the data.
Profit by Region report:
Drill-down to Profit by Region and Product Category:
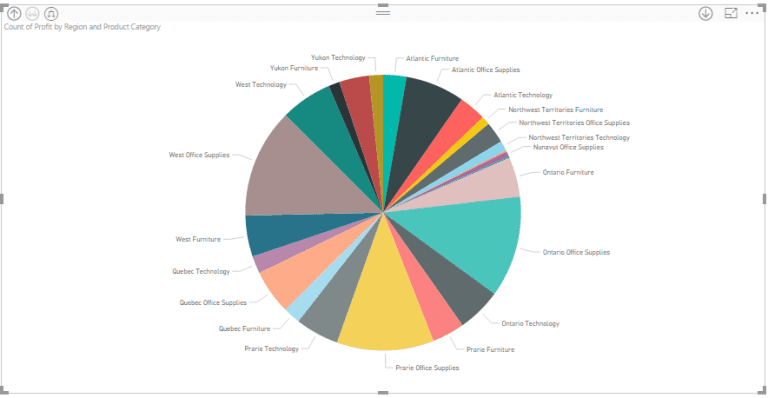
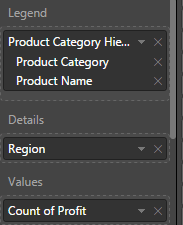
Pie Chart visualization configuration:
Next let's create another data set called Sales Users and append it to the Store Sales data set. First select the bar chart report in the ribbon and then select Edit Queries. The Query editor window appears. Within the Query editor ribbon, select the Combine icon.
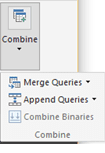
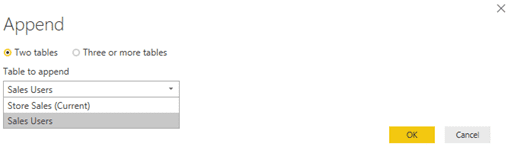
Then select Append Queries and Ok. In the Append window select the Two tables option and then Sales Users in the Table to append dialog. Select Ok.
In the Query Editor window select Close & Apply to append the Sales Users data set to the Store Sales dataset.
Publish a report to the Power BI service from the Power BI desktop application
Now that I have created the Product Profit report, it is time to publish it to Power BI. In the Power BI desktop application ribbon, select the Publish icon.

If prompted, enter your Power BI credentials. Once published, you can now share the report with other users that have a Power BI account.
Product Category and Region Profit report:
Creating content packs and dashboards
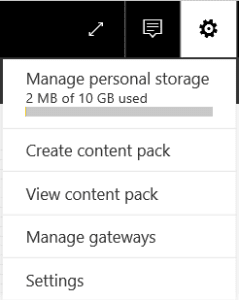
With the report loaded in Power BI, I can now create what is called a content pack. A content pack saves a report, dataset, or dashboard as a template for my organization or for a specific user. The "View content pack" option displays which content packs have been published. The "Manage gateways" option shows connections to your on-premises gateway server.
Power BI allows you to create dashboards. Let's pin the Product Profit report to a newly created dashboard named "Product Profit dash."
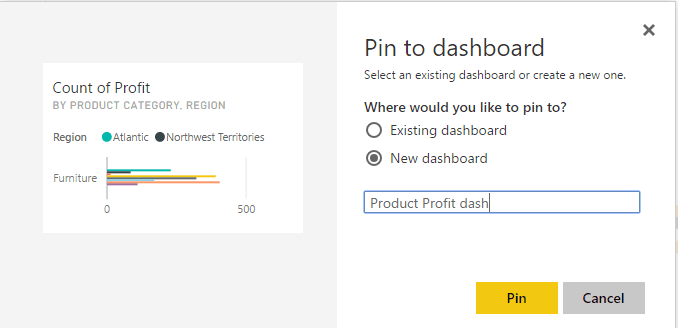
To create a Dashboard, I will select the Product Profit report and click on the thumbtack icon.
The Pin to Dashboard pop-up window opens, and here I'll select New dashboard. Let's call the dashboard "Product Profit dash" and select Pin.
Using Natural Query Language to filter data
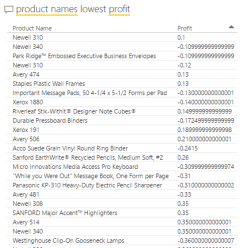
With the report saved as a dashboard, users can leverage the Natural Query Language to filter the data. For example, I can use the Product Profit report from the dashboard to filter by product name with the lowest profit.
To access my report within the dashboard, I select Product Profit and type "product names lowest profit" in the Ask a question about your data field.
Product Category and Region Profit dashboard:
What other options are available with Power BI?
In order to display in SharePoint Online a report that you have published to Power BI, you will need to meet the following requirements:
- Your Office 365 instance will need to be setup with the first release option.
- The first release option must be set for everyone.
- SharePoint Online must use Modern Pages.
- Any user that will view the embedded report will need a Power BI Pro subscription.
For more information about integrating Power BI reports with SharePoint Online, click here.
Scheduling a data refresh
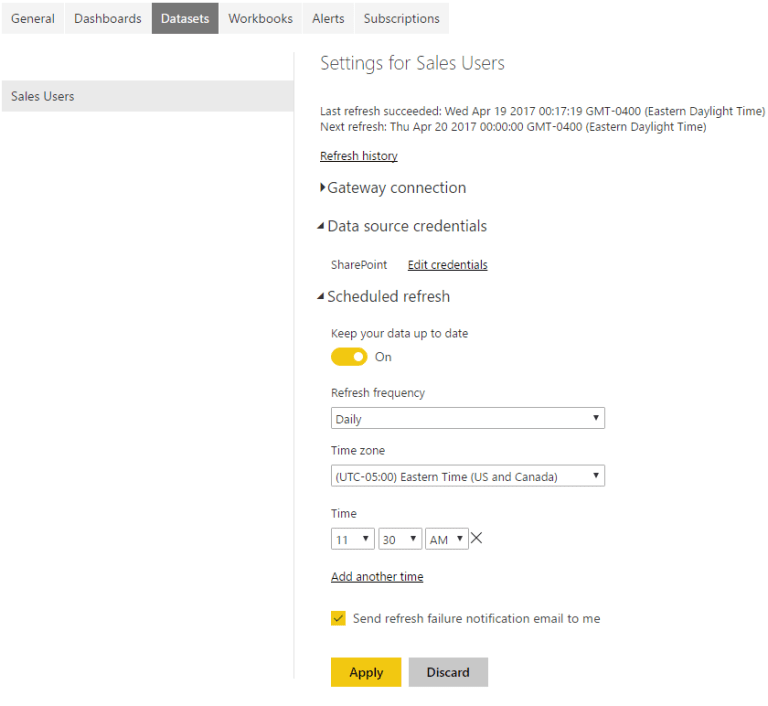
You can schedule your report to sync to its dataset so the data remains up to date. Let's setup a schedule to refresh the data for our report. In the Power BI service ribbon select the gear icon.

Select Settings from the dropdown menu. In the Settings menu select the Datasets tab. In the data source credentials section provide the login information for an account that has owner permission to the data source. Under the Scheduled refresh section turn on the Keep your data up to date slider. There are only two types of refresh - Daily or Weekly. Select Daily for this example. Schedule the refresh for 11:30 AM Eastern and select Apply.
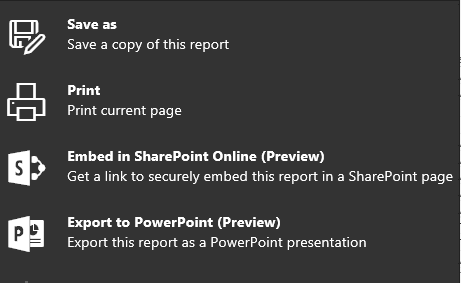
Exporting reports
You can also export reports into PowerPoint so you can insert your report into a presentation.
Summary
This is just a sample of what you can do with the Power BI reporting service. By utilizing Power BI, reports can be created and deployed by any user with a subscription, and the user doesn't have to be a developer or a report writer to do it. This is a powerful tool to create meaningful, visual reports using the existing information that you already have in SharePoint or external data.
Reference Section
If you would like some more information on topics we covered, please visit these sites: